Week 2
Research
On the software side, my main two ideas right now are a real-time globe where you can click anywhere to “teleport” to the air quality there, or a narrative story like I made on natural gas that looks at one place (London? NYC?) over time and draws connections to current NYC politics. I’ll get the basic interaction of a graph on a website & networking on the Arduino working this week, and decide the full scope later.
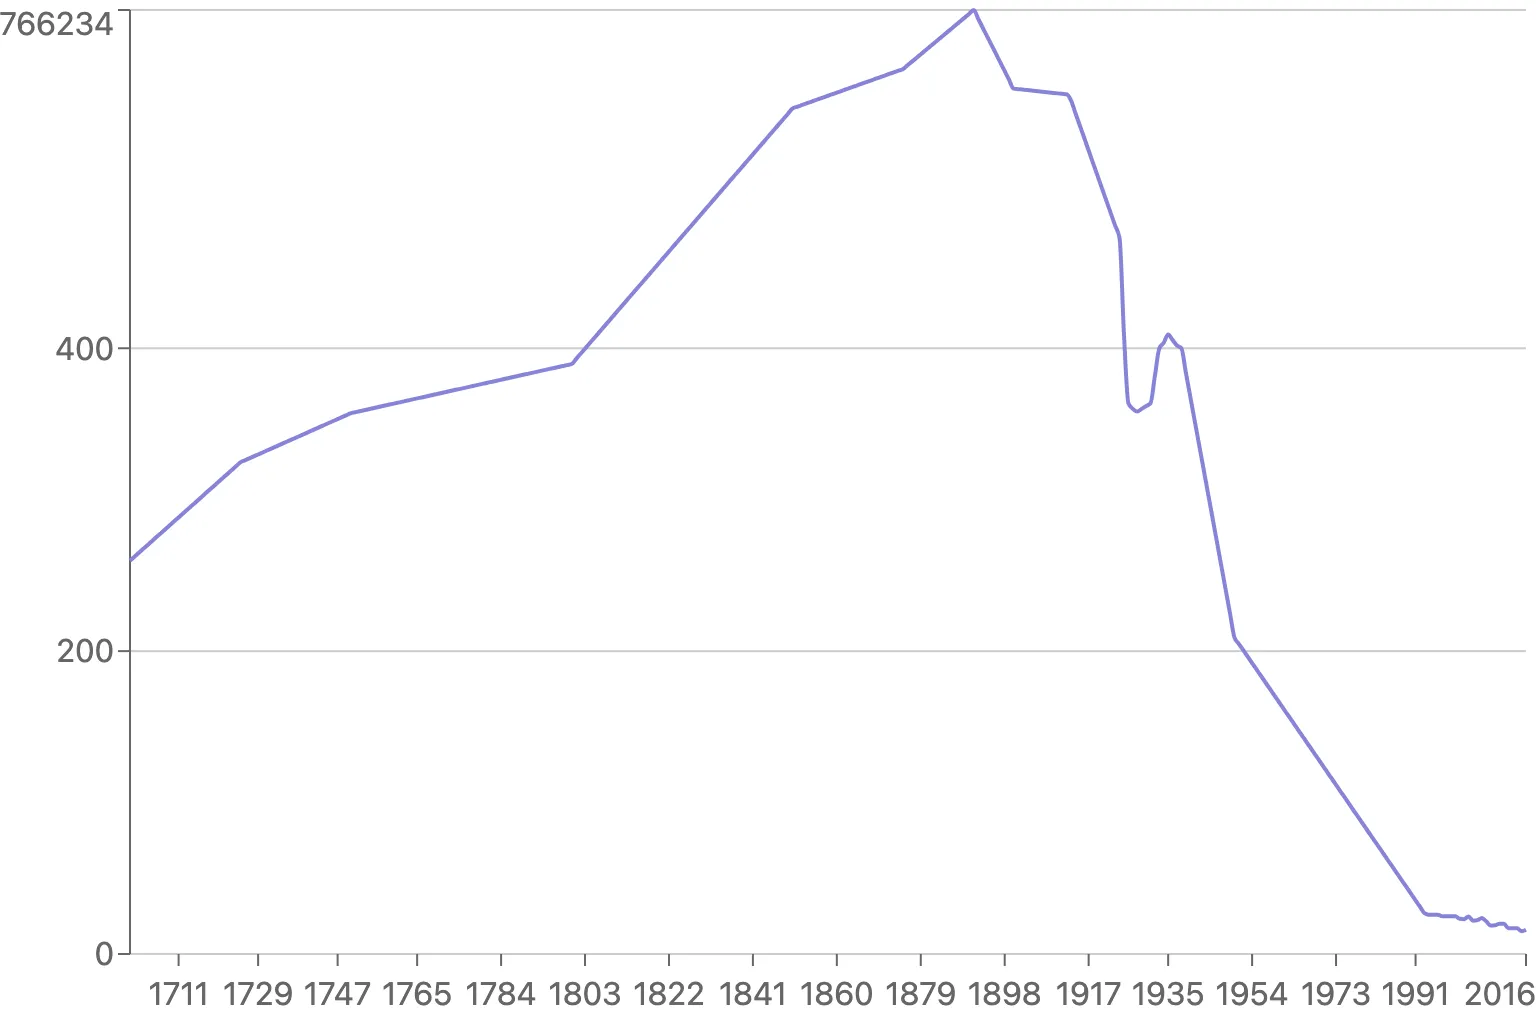
As of now, I’m planning to base the experience off this article in Our World in Data since it features both data & narrative I can use as a starting place. I am planning to look into historical air quality data for NYC instead of London, but for now, the data is easy to work with.
Plan
Last spring, taking Kate Hartman’s Haptics class, I made a project that extended the Apple Vision Pro experience with finger haptics. In a tight two hours, the physical fabrication was not strong, but it made the point. I spent the majority of my time trying to set up the connection between the website and the Arduino, and settled on using Liveblocks as a WebSockets server host with Wi-Fi on the Arduino.
This week, I wanted to get the basic networking stack set up for the project, for communication between the Arduino and the website,
MVP of the website UI
First, I downloaded the Our World in Data data as a CSV, cleaned it up in Numbers, then converted it to JSON. (bunx csvtojson public/cities.csv > public/cities.json)
Then, I duplicated my Vite/React/Liveblocks setup from the haptics project repo, and made a new Liveblocks room for this project. I installed recharts for the graph, and made a basic graph of the data. Nothing special visually:
When hovering over the graph, I need to convert the percentage of the range to a number between 0-255, to send to the Arduino. ChatGPT suggested a quick function to do this, and I used React state to keep track of the current level highlighted.
Then, I layered in the Liveblocks SDK to send the current level to the Arduino, using the useBroadcastEvent hook. Here’s the full code:
import React from "react";import { RoomProvider, useBroadcastEvent } from "./liveblocks.config";import { Line, LineChart, CartesianGrid, XAxis, YAxis } from "recharts";import chartData from "../public/london.json";
const minSpm = chartData.map((d) => d.spm).reduce((a, b) => Math.min(a, b));const maxSpm = chartData.map((d) => d.spm).reduce((a, b) => Math.max(a, b));
export default function LiveblocksProvider() {  return (    <RoomProvider id="air-quality" initialPresence={{}}>      <App />    </RoomProvider>  );}
const scaleToRange = (value, min, max, scaledMin, scaledMax) => {  return Math.round(    ((value - min) / (max - min)) * (scaledMax - scaledMin) + scaledMin,  );};
function App() {  const broadcast = useBroadcastEvent();  const [currentLevel, setCurrentLevel] = React.useState(0);
  const handleMouseMove = (state) => {    if (state && state.activePayload && state.activePayload.length) {      const currentValue = Number(state.activePayload[0].value);      // map currentValue to 0-255      const level = scaleToRange(currentValue, minSpm, maxSpm, 0, 255);      setCurrentLevel(level);      if (level !== currentLevel) {        broadcast(level);      }    }  };
  return (    <LineChart      width={768}      height={512}      data={chartData}      onMouseMove={handleMouseMove}    >      <CartesianGrid horizontal={false} />      <XAxis dataKey="year" axisLine={false} tickMargin={8} />      <YAxis domain={[0, maxSpm]} />      <Line        type="monotone"        dataKey="spm"        stroke="#8884d8"        dot={false}        strokeWidth={2}      />    </LineChart>  );}
Arduino
Forking my haptics project script, I got the basic setup of the Arduino connecting to Wi-Fi (the ITP Sandbox network) and listening for events from Liveblocks. Unfortunately, since I built that project, Liveblocks has changed their data format to transmit events as JSON instead of raw values when you broadcast events. I installed the Arduino JSON library, but the parsing doesn’t always seem to work, and the code is complex.
I was perusing old GitHub repos and found sunscreenglow, which used Adafruit IO, which I’d totally forgotten about, though it sent data from the Arduino then the website was read-only. That said, it might be easier to work with than Liveblocks, so I’ll try that next week.
Hardware
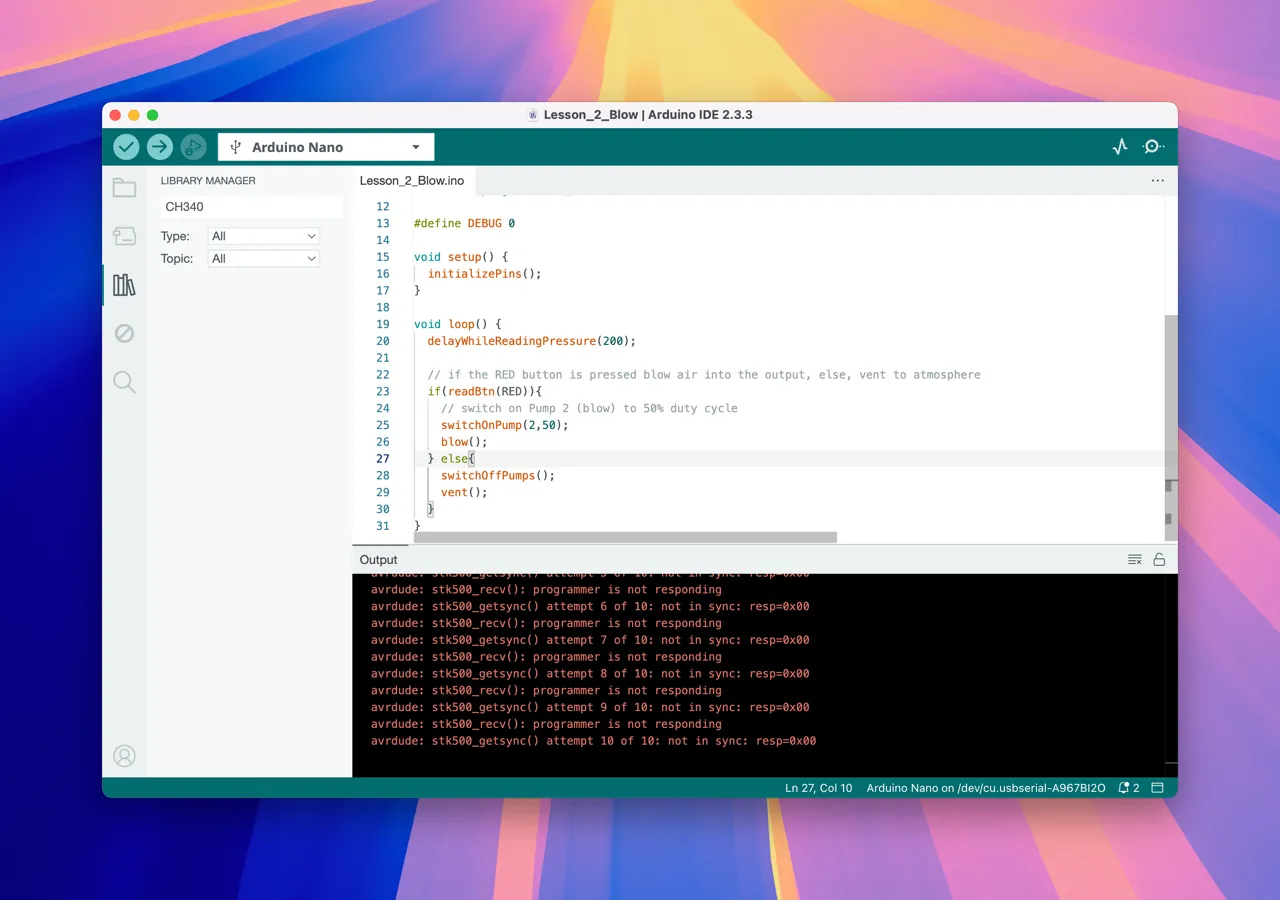
I borrowed a Programmable Air pump from the ITP Shop, and followed their code instructions, installing the Chinese manufacturer’s driver on my Mac and installing their Arduino library. I then uploaded their example code to the Arduino, but it didn’t work. I’ll need to troubleshoot this next week.
Next week
3 main goals:
- Get the air pump working with the Arduino
- Switch the code to Adafruit IO
- Buy an inflatable pillow